React, Redux, Front-End Development
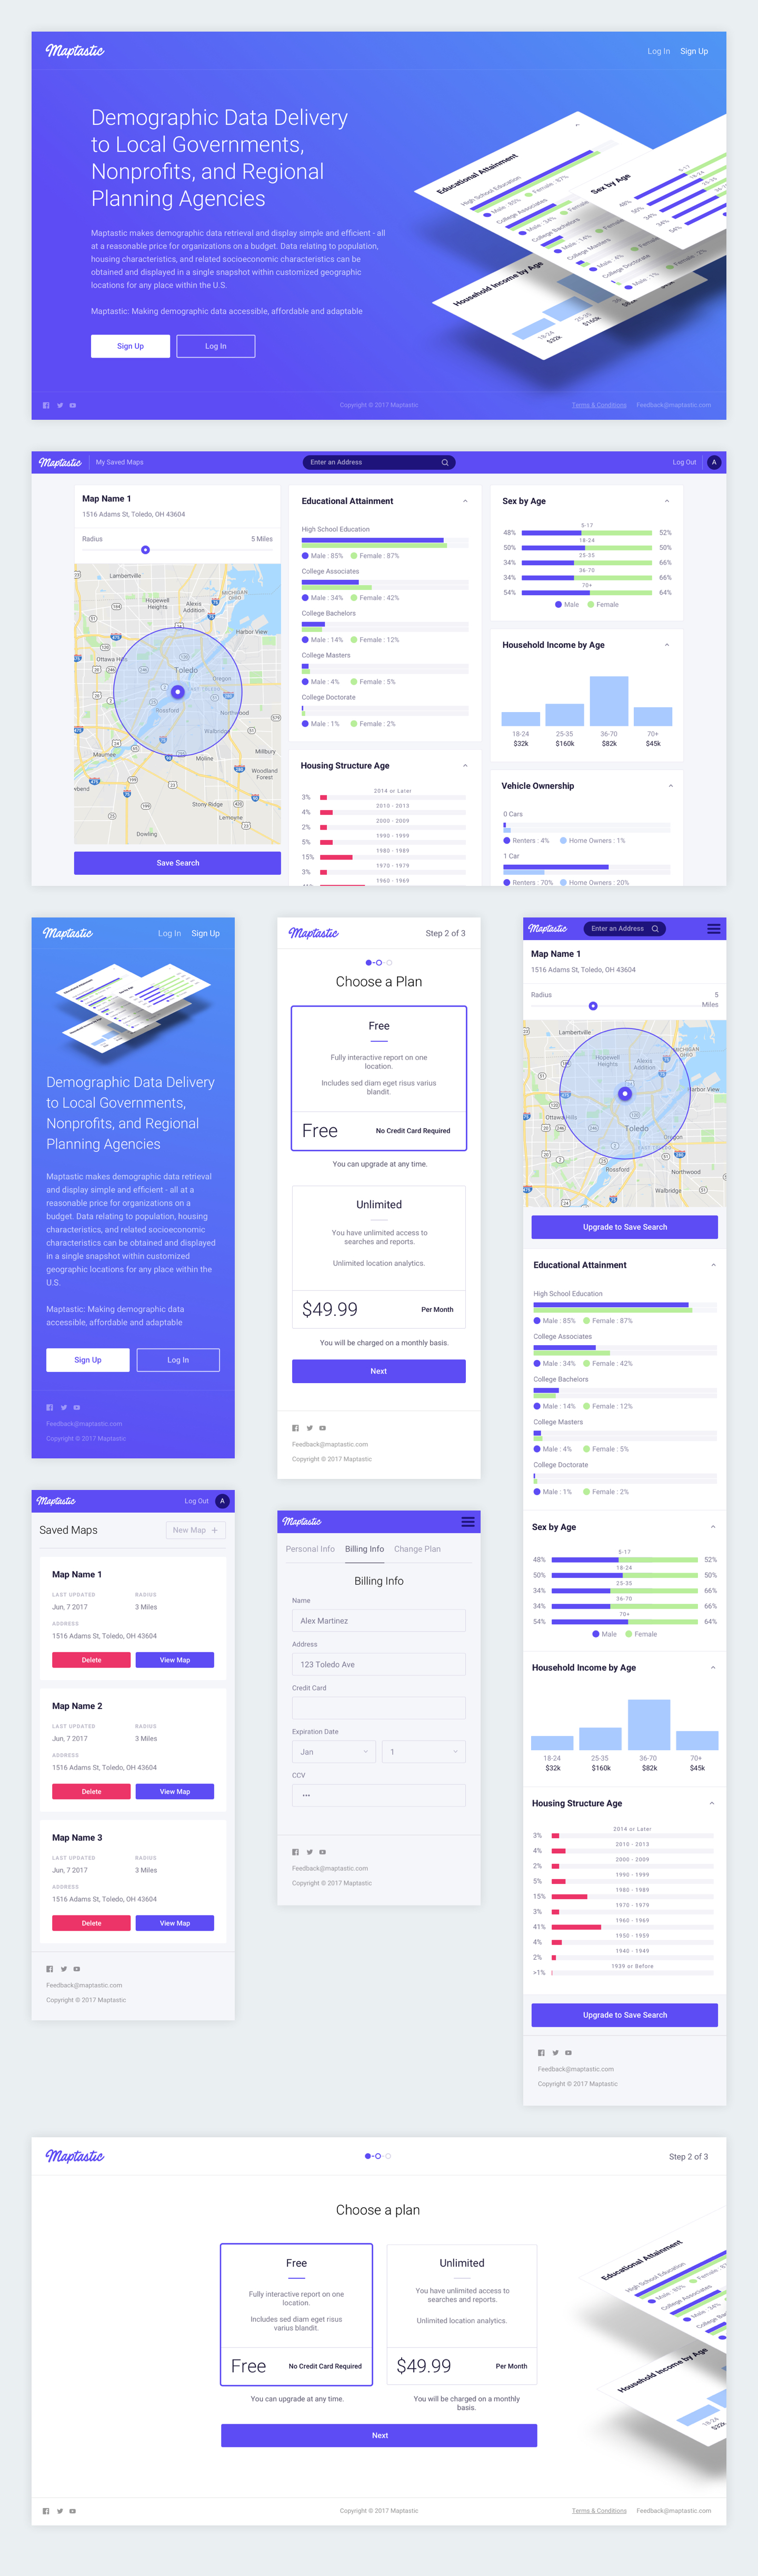
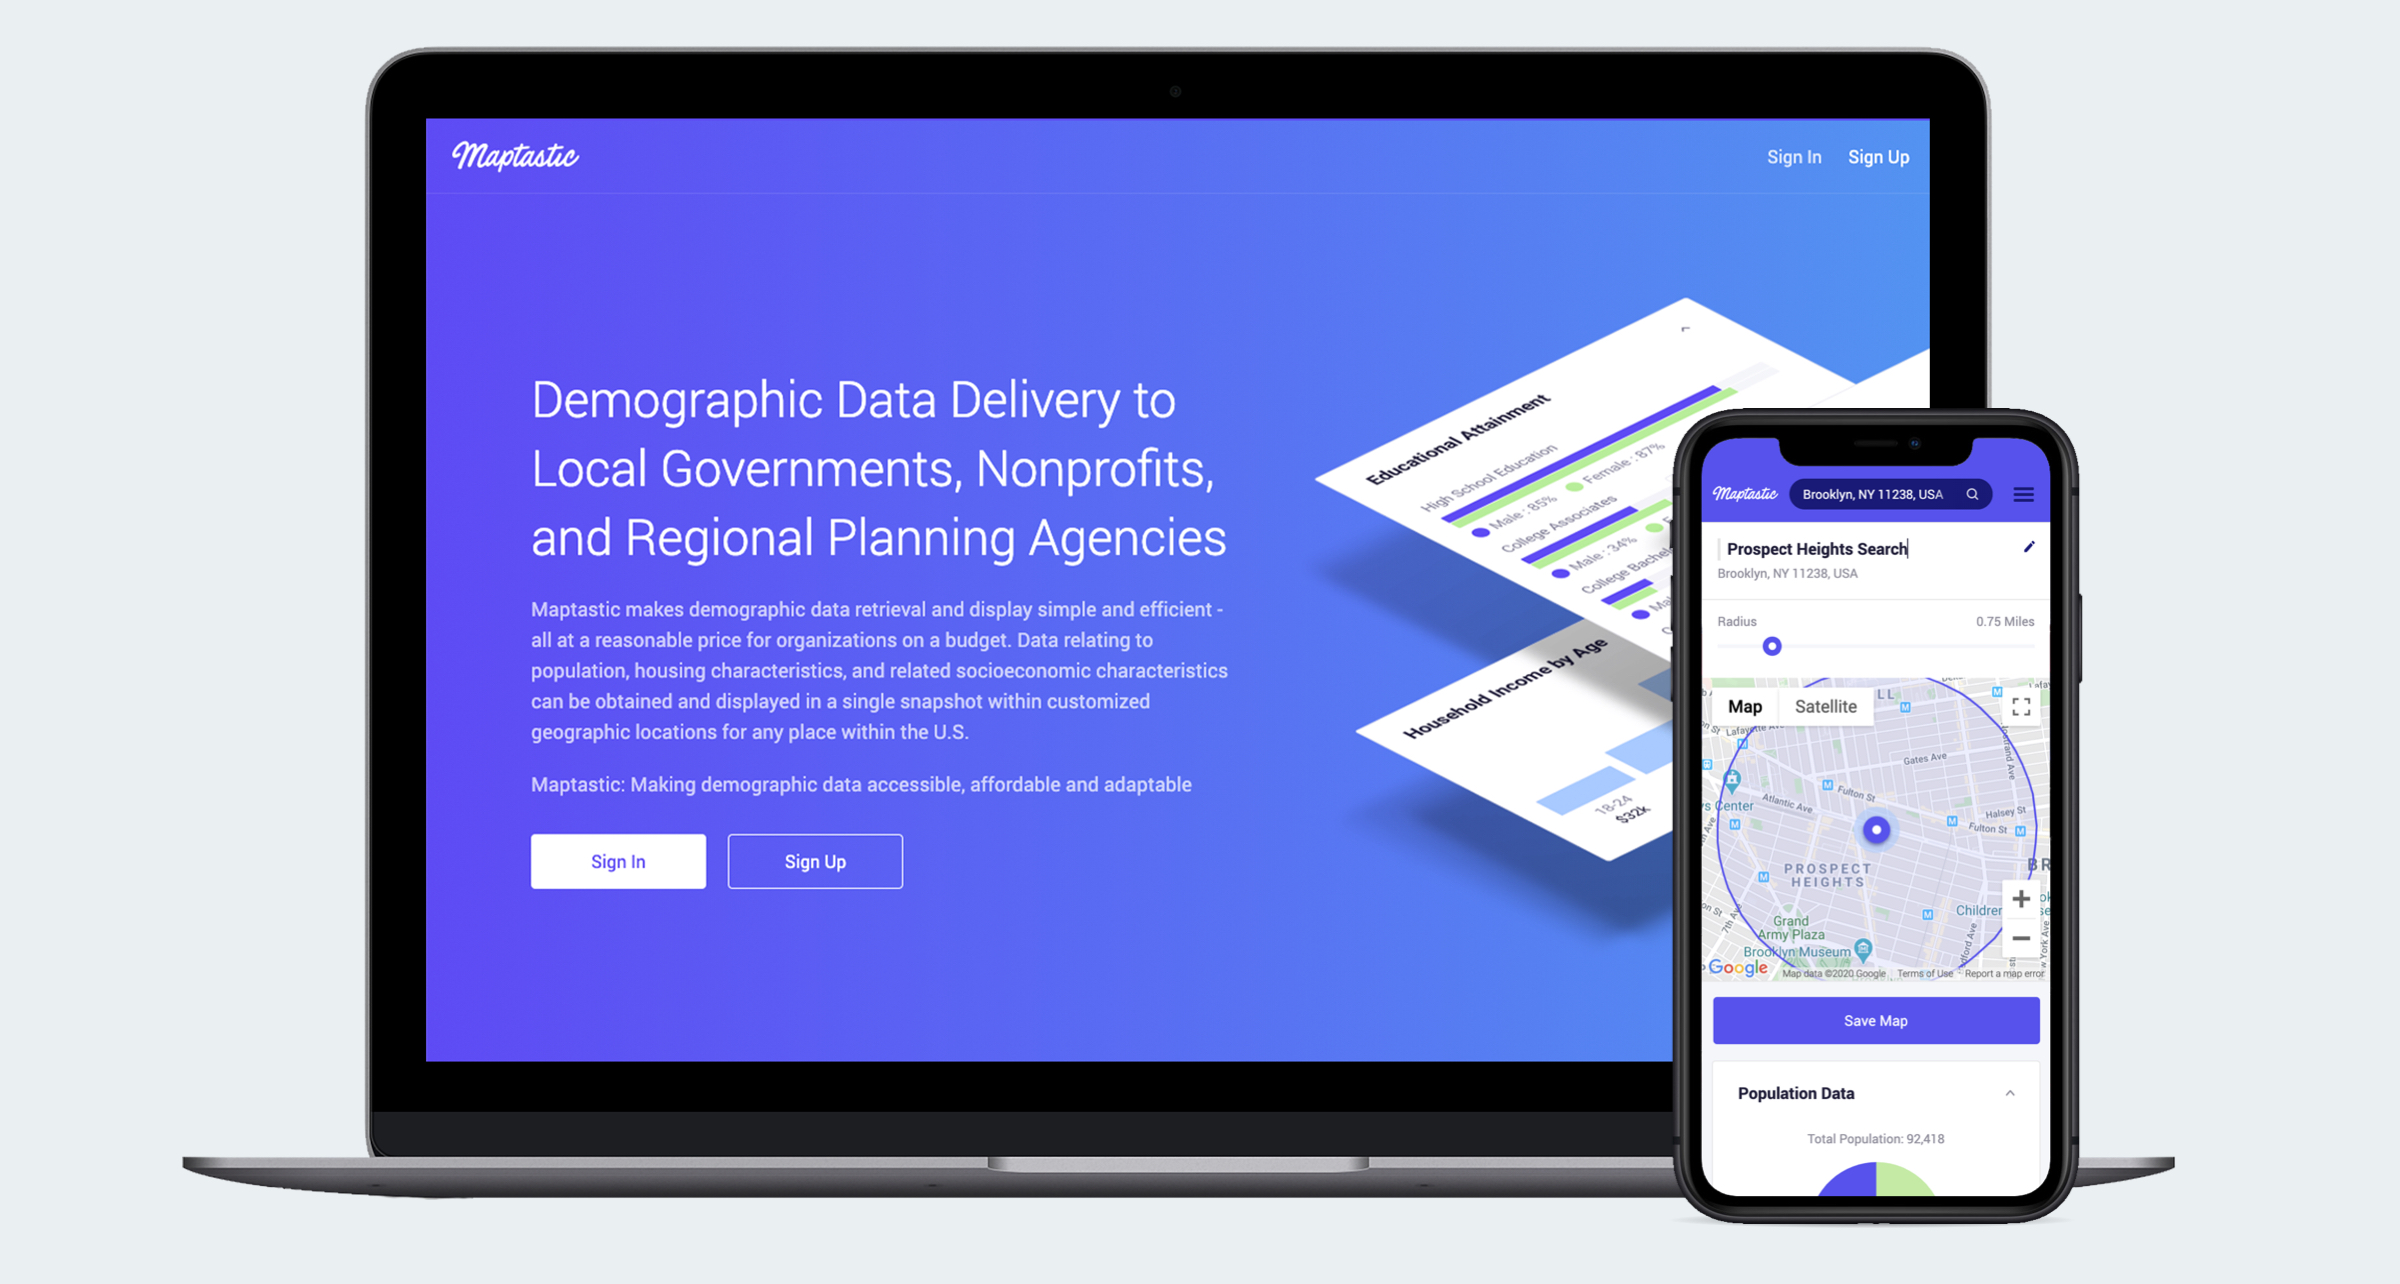
Maptastic
A web application that makes U.S. demographic data retrieval and display simple and efficient.
Project Overview
Maptastic was a React web application that makes U.S. demographic data, such as population, housing characteristics, and related socioeconomic characteristics easily obtainable to local governments, nonprofits, and regional planning agencies.
Organizations can use the app to search demographic data for regions throughout the U.S. and save their searches for future reference.
My Role
As part of a small team at Whitelabel, I served as the lead front-end developer and worked with a designer and several backend developers to bring the project to life.
Maptastic gave me the opportunity try out new libraries like Chartist, used to display data obtained through U.S. Census APIs, and explore the Google Maps API and Geosuggest (through libraries like React Geosuggest) for geolocation searches.
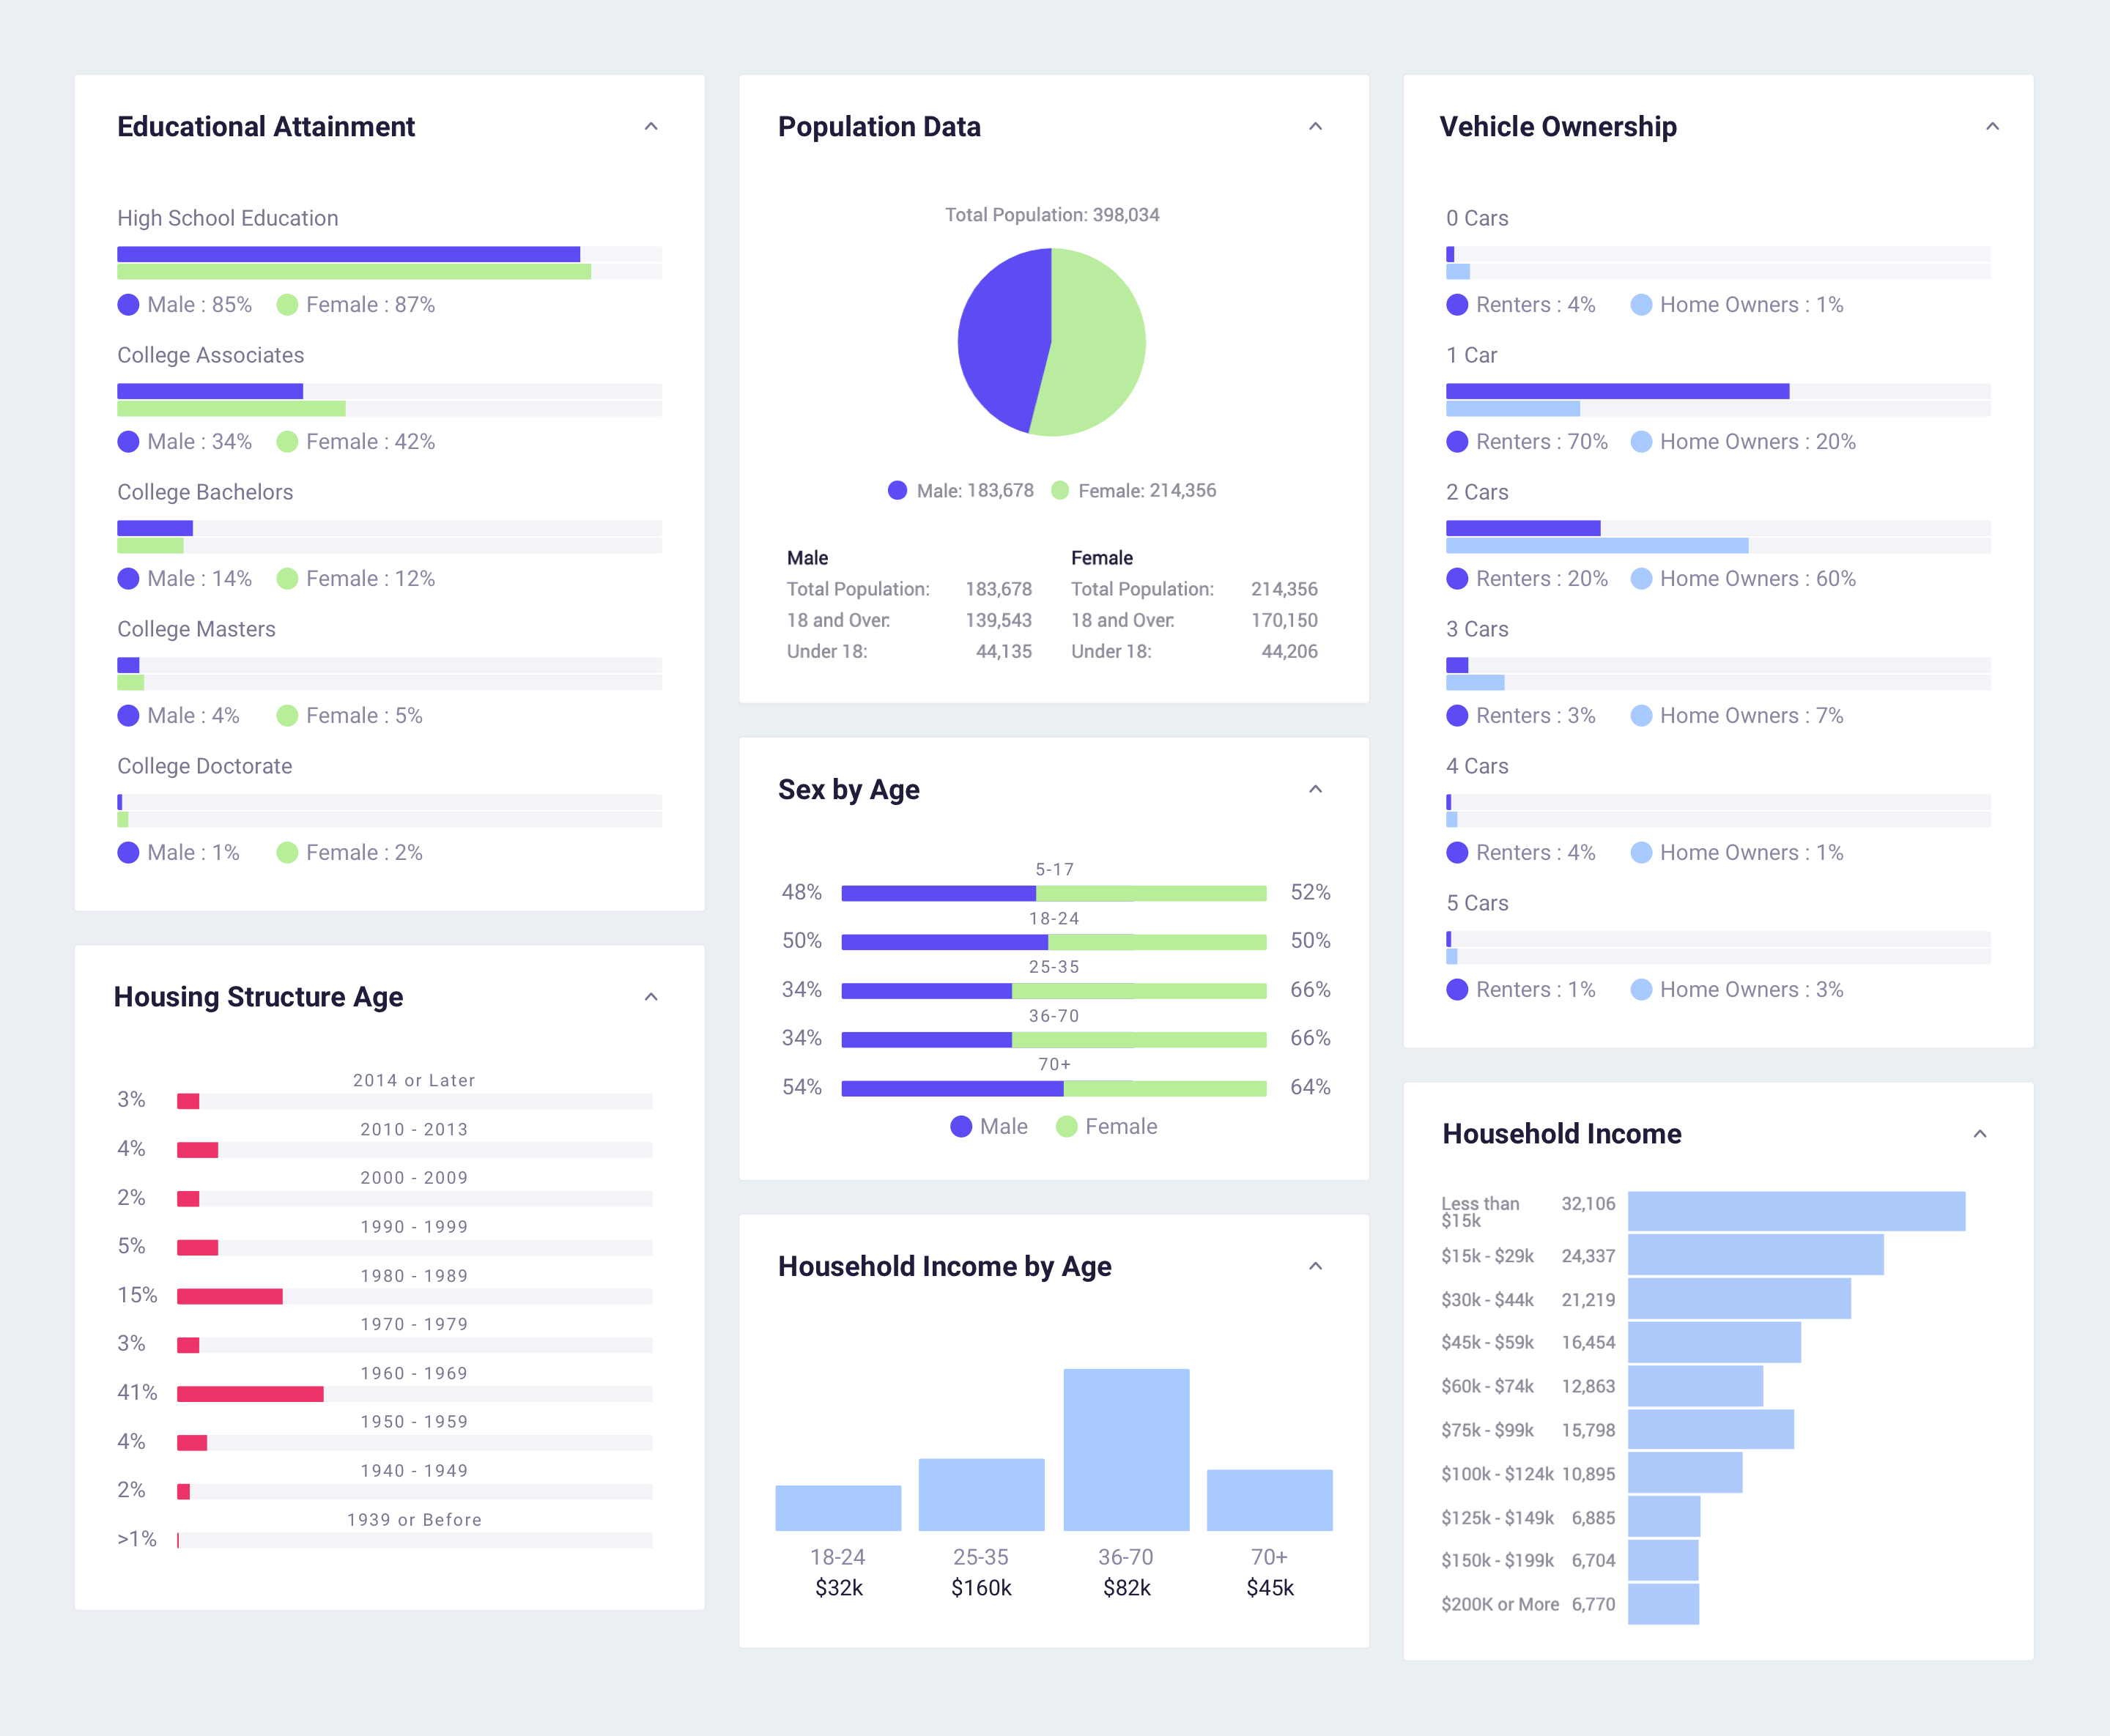
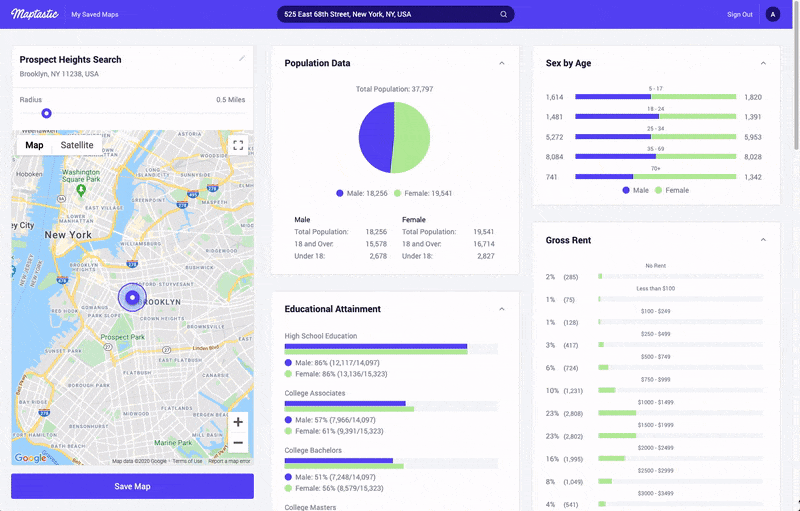
Making Data Beautiful
Chartist Graphs
In order to make large amounts of demographic data easy to understand, we used Chartist to create a variety of charts, from comparison bar charts to pie charts, to visualize the data.
Chartist proved to be a handy library that allowed for easy customization and let me build a set of restackable, collapsible cards for the end user.
A Flexible, Responsive Layout
Using Flexbox, I created a responsive masonry-style layout to accomodate a range of device sizes. It was important to give the map and chart cards room to breath in order keep data digestible, but the layout also had to be flexible enough to re-stack on smaller devices.
Fixed Positioning
Additionally, on desktop, we wanted to keep several elements, such as the map and main navigation, in a fixed position so that users could scroll through the cards of data, but always have easy access to these primary elements in order to refine their search location and radius.
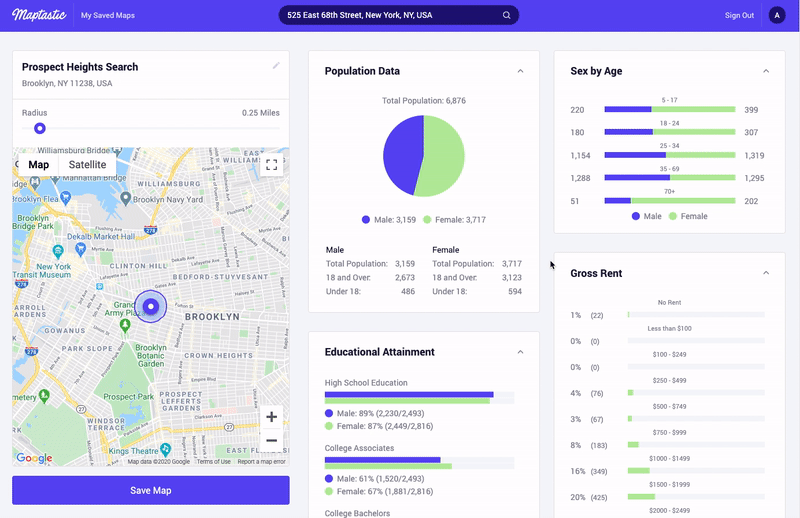
Maps Integration
As the name “Maptastic” implies, maps (and location search) were a critical part of the project. Our goal was to allow users to easily search for a location, visualize it via Google Maps, and modify their search radius to hone in on their targets.
Searching on Maptastic
The search experience is comprised of three primary elements:
- A geosuggest search input
- A Google Map to display the search
- A slider to refine the range of the search area
By using React Google Maps to tie into the Google Maps Javascript API, React Geosuggest to create a suggestive search input, and Redux to allow the components access to a shared state, I was able to create a search experience that makes accessing demographic data a breeze.
Conclusion & Lessons Learned
While concise in scope, Maptastic helped me explore new terrain. From learning how interact with and customize map elements with Google Maps to styling large chunks of data using Chartist, this project exposed me to new front-end features. Front-end development continues to excite me as I discover how much more there is to learn every day.